
Building Usage-Based Billing for The LiveRamp Clean Room with Spark Execution Metrics

Key takeaways
- LiveRamp introduced usage-based billing for TEE clean rooms without adding customer-facing processing overhead.
- Spark execution metrics enabled accurate measurement of real data usage during query execution, eliminating the need for expensive standalone counting jobs.
- Custom Spark plan nodes preserved business context throughout execution, enabling precise attribution across customers, datasets, and data connections.
- The observability framework built for billing now delivers broader platform insights that help improve reliability, efficiency, and future feature development.
Measuring customer usage sounds simple – until you're operating a distributed data processing platform where measurement itself can become expensive.
As usage-based contracts become available for the LiveRamp Clean Room, we faced a challenge: how do you accurately measure customer usage without introducing additional processing costs, increasing infrastructure spend, or slowing customer workloads?
Historically, billing was determined on a case-by-case basis and issued as a static figure that implicitly accounted for variable usage. Usage-based contracts expand that model, giving customers more flexibility to start small, scale adoption as collaboration grows, and align costs more closely with the value they extract from the platform. Supporting this new pricing model required us to accurately measure how customers use the platform. More importantly, we needed to do so without adding overhead to the workloads already powering our Trusted Execution Environment (TEE) clean rooms.
To solve this challenge, we added instrumentation to the Spark jobs powering our TEE clean rooms. Today, we record detailed usage metrics on a per-input basis for every question run and provide those metrics to LiveRamp's central billing systems. This was achieved using QueryExecutionListeners and custom PlanNodes, allowing Spark's execution metrics to be translated into concepts meaningful to our business and customers.
Why traditional measurement wouldn't work
Before implementation began, LiveRamp consulted external analysts to determine an appropriate measure of question-run complexity. Their recommendation was straightforward: use the number of unique rows accessed from each input dataset, without increasing charges for repeated access to data that had already been imported into the execution environment.
At first glance, the solution seemed obvious. "Easy," I hear you say. "COUNT(*) the rows and move on to some tech debt."
Unfortunately, it wasn't that simple. While a straightforward count would have satisfied the minimum requirements, it came with several significant drawbacks. In attempting to measure usage, we would actually increase the amount of work performed by the platform. Full dataset counts would either need to run asynchronously – introducing operational complexity – or directly increase the runtime of customer questions.
If we wanted to measure rows actually used by a query rather than all rows available to it, things became even more complicated. We would need to analyze SQL and Python code, identify filters and joins, and apply those transformations when calculating counts. We could have accepted the additional cost and complexity, but the solution felt fundamentally compromised. We wanted usage metrics that reflected actual work performed by the platform without creating additional work solely for measurement.
Spark already generates detailed execution metrics during query processing. We knew those metrics existed because they were visible through the Spark UI. The challenge became figuring out how to access and operationalize them.
Capturing usage without slowing workloads
Our guiding light during this phase was the Spark Web UI. From the Stages tab, we knew Spark was recording per-stage output counts during execution. Through experimentation, we discovered these counts reflected records actually accessed rather than records merely available. Even better, they were recorded with input-specific granularity.
This was exactly what we needed. Now all that remained was figuring out how to get the numbers out of Spark and into something accessible by the rest of our platform. Because these metrics are generated during normal query execution, they provide accurate usage attribution without requiring additional processing or impacting customer workloads.
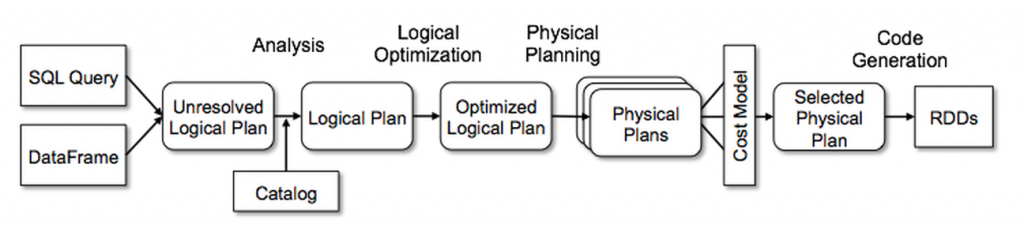
Spark's execution model relies on a progression of transformations applied to its directed acyclic graph representation of a query. Queries that begin as unresolved LogicalPlans are enriched with catalog information, optimized, mapped to physical data sources, and ultimately executed. Since the metrics we wanted were generated during execution, we needed access to plans late in this lifecycle. Fortunately, Spark provides QueryExecutionListeners, allowing users to observe execution events and analyze execution metrics.
On both success and failure, the QueryExecutionListener provides access to the executedPlan via the qe: QueryExecution parameter. Setting up a local Spark environment, and inspecting executed plans through debug mode, allowed us to discover that in the metrics of certain nodes a numOutputRows was being recorded, which matched the figures displayed in the Web UI.
To programmatically access this data, we implemented a depth-first tree traversal algorithm that recursively accessed nodes through their children and recorded metrics based on the SparkPlan type encountered. However, we quickly realized the metrics were not being recorded consistently across all inputs. In some cases, important identifying information was also missing or moved elsewhere in the tree.
Given the breadth of supported customer inputs, we adopted an exploratory approach. Rather than attempting to support every input type upfront, we initially deployed a NoOp version of our RowCountMetricListener instrumented with logs and audits. This allowed us to identify missing metrics, unexpected nodes, and traversal dead ends without impacting production behavior.
As new inputs emerged, we implemented handling as high as possible in Spark's inheritance hierarchy, maximizing coverage while minimizing implementation effort. Through weekly iteration, we gradually expanded support across all available input types.
Finally, we had data. Unfortunately, we still didn't have context.
Spark's optimization and execution process had stripped away the business concepts we cared about: datasets, organizations, accounts, and data connections. We could identify that 400 rows had been read from a particular source, but we couldn't determine who owned that data, how it entered the clean room, or which customer should be billed.
Connecting technical metrics to customer value
Our initial implementation registered a QueryExecutionListener directly on the SparkSession used by the platform. This immediately introduced a challenge: the listener captured every execution occurring within the session, not just customer workloads. We initially addressed this through custom runtime configuration. Customer executions were tagged with identifiers that allowed us to separate customer activity from platform activity.
This approach worked, but only partially.
We still lacked a reliable way to preserve business context as Spark transformed LogicalPlans into PhysicalPlans. After experimenting with several approaches, we ultimately decided to introduce that capability ourselves. Because customer datasets are exposed through views before they become available within the TEE environment, we identified that layer as the ideal place to attach business metadata. As an added benefit, any access routed through those views could now be confidently attributed to customer activity.
Looking back, this is a good example of what tech founder Barry O'Reilly describes as residuality in software systems: solving one problem often creates opportunities to solve others. We originally introduced this capability to preserve business context for billing, but it ultimately became useful for observability, attribution, and debugging as well.
To preserve business metadata throughout Spark's optimization process, we introduced a custom plan node: AnnotatedDatasetNode.
package org.apache.spark.sql.annotation
import org.apache.spark.sql.catalyst.expressions.Attribute
import org.apache.spark.sql.catalyst.plans.logical.{LogicalPlan, UnaryNode}
case class AnnotatedDatasetNode(
override val child: LogicalPlan,
organizationId: String,
datasetId: String,
dataViewSubConnectionId: Option[String] = None
) extends UnaryNode {
override def output: Seq[Attribute] = child.output
override protected def withNewChildInternal(newChild: LogicalPlan): LogicalPlan = copy(child = newChild)
}
This is a UnaryNode as it only has a single child, and all required methods are overridden with that child’s implementation. This means that during execution this node is effectively a non-entity, not transforming the output of the child it wraps in any way. What is important are the case class’s string parameters which will contain IDs vital for identifying metrics during the tree traversal described in the previous section.
First, though, the AnnotatedDatasetNode must survive the process of transformations which a LogicalPlan undergoes. To accomplish this, we had to provide Spark with a SparkStrategy to handle the AnnotatedDatasetNodes when converting the LogicalPlan into a PhysicalPlan. This, too, was very simple.
package org.apache.spark.sql.annotation
import org.apache.spark.sql.catalyst.plans.logical.LogicalPlan
import org.apache.spark.sql.execution.{SparkPlan, SparkStrategy}
object AnnotatedDatasetStrategy extends SparkStrategy {
override def apply(plan: LogicalPlan): Seq[SparkPlan] = plan match {
case AnnotatedDatasetNode(child, organizationId, datasetId, dataViewSubConnectionId) =>
Seq(AnnotatedDatasetExecNode(
child = planLater(child),
organizationId = organizationId,
datasetId = datasetId,
dataViewSubConnectionId = dataViewSubConnectionId
))
case _ => Nil
}
}
In the AnnotatedDatasetExecNode, we follow the same methodology as in the AnnotatedDatasetNode.
package org.apache.spark.sql.annotation
import org.apache.spark.rdd.RDD
import org.apache.spark.sql.catalyst.InternalRow
import org.apache.spark.sql.catalyst.expressions.Attribute
import org.apache.spark.sql.execution.{SparkPlan, UnaryExecNode}
case class AnnotatedDatasetExecNode(
override val child: SparkPlan,
organizationId: String,
datasetId: String,
dataViewSubConnectionId: Option[String] = None
) extends UnaryExecNode {
override protected def doExecute(): RDD[InternalRow] = child.execute()
override def output: Seq[Attribute] = child.output
override protected def withNewChildInternal(newChild: SparkPlan): SparkPlan = copy(child = newChild)
}
The result was a custom AnnotatedDatasetNode capable of preserving organization, dataset, and connection metadata throughout Spark's optimization process.
This closed two critical gaps: Not only could we collect accurate execution metrics, but we could now attribute those metrics to the correct customers, datasets, and business entities. We could also clearly distinguish customer-generated execution costs from platform-generated activity.
Handling complexity at scale
As with most distributed systems work, implementation was not entirely straightforward. We encountered early issues involving Spark's evaluation model, where attempts to collect metrics inadvertently triggered query re-execution. We also experienced problems caused by improperly registered SparkStrategies that prevented certain execution paths from resolving correctly.
More interesting challenges emerged around partitioned data connections and views. In both cases, a single logical connection could be represented by multiple nodes within a SparkPlan. This introduced scenarios where usage could be undercounted because separate reads appeared to belong to the same dataset.
- node: AdaptiveSparkPlanExec, executionId: 92
- node: BroadcastHashJoinExec
...
- node: BroadcastHashJoinExec
- node: AnnotatedDatasetExecNode dd50a2b6-9f6e-465a-a8da-41691c17c1c2, 92db0fa5-e114-4320-82f7-d6d638ea4596
- node: FileSourceScanExec, count: 100
- node: AnnotatedDatasetExecNode dd50a2b6-9f6e-465a-a8da-41691c17c1c2, 92db0fa5-e114-4320-82f7-d6d638ea4596
- node: FileSourceScanExec, count: 100
Above is an excerpt from our logs, a reduced version of Spark's own explainPlan targeted at just the nodes relevant to our metrics. The plan represents a partitioned data connection: a single data connection consisting of several reads from partitioned files. These are combined before being exposed to the customer query.
Because the two AnnotatedDatasetExecNodes shared the same IDs, they appeared to belong to the same dataset, even though we knew they represented separate connections within the view. During billing event creation, they would have been deduplicated, resulting in only 100 rows accessed being billed instead of 200. This mattered because our billing logic intentionally bills for the highest usage per dataset. In this case, however, that deduplication would have hidden a significant portion of real usage.
- node: AdaptiveSparkPlanExec, executionId: 92
- node: BroadcastHashJoinExec
...
- node: AnnotatedDatasetExecNode dd50a2b6-9f6e-465a-a8da-41691c17c1c2, 92db0fa5-e114-4320-82f7-d6d638ea4596
- node: BroadcastHashJoinExec
- node: AnnotatedDatasetExecNode dd50a2b6-9f6e-465a-a8da-41691c17c1c2, 92db0fa5-e114-4320-82f7-d6d638ea4596, 2c302f2a-2fe7-477f-b209-21dc16cb7696
- node: FileSourceScanExec, count: 100
- node: AnnotatedDatasetExecNode dd50a2b6-9f6e-465a-a8da-41691c17c1c2, 92db0fa5-e114-4320-82f7-d6d638ea4596, ecc2ee4a-1735-478a-bfb8-8d4171353110
- node: FileSourceScanExec, count: 100
To address this, we fundamentally changed how usage statistics were aggregated. Rather than generating metrics directly from individual execution nodes, we shifted to aggregating metrics through AnnotatedDatasetExecNodes. We added an additional UUID to the deepest AnnotatedDatasetExecNodes to distinguish separate reads, while introducing a higher-level encircling node to associate them and mark the root of the aggregated sub-tree.
This allowed us to track distinct reads independently while still rolling them up into a single business-level entity. The result was significantly more accurate usage attribution and billing information, particularly for complex workloads.
Unexpected platform benefits
While usage-based billing was the original objective, one of the most valuable outcomes of this work has been the visibility it created across our Spark infrastructure. These metrics always existed within Spark, but they were not previously exported, retained, or easily accessible after execution completed. By collecting and storing them centrally, we gained a much richer understanding of platform behavior.
That visibility has already helped us:
- Identify and resolve query re-execution issues caused by lazy evaluation
- Discover opportunities for more effective caching
- Improve understanding of background platform workloads
- Accelerate implementation of new features by providing deeper operational insight
Importantly, these benefits extend beyond billing. From the outset, we treated metrics as a product rather than merely a dependency of the billing system. Billing became a consumer of the data rather than its owner. That decision has allowed engineering teams across the platform to benefit from the same observability investments.
I was also impressed by how well this approach translated to Clean Compute Clean Rooms. Because views are registered and annotated consistently, and because metrics are gathered directly from Catalyst-generated SparkPlans, supporting Python-based workloads required only minimal additional work.
Building the future of LiveRamp Clean Room infrastructure
What began as an effort to support usage-based billing ultimately benefitted the entire platform’s observability infrastructure. By leveraging Spark's existing execution metrics, extending Catalyst with custom plan nodes, and preserving business context throughout execution, we built a solution that accurately measures customer usage without introducing additional queries, infrastructure costs, or latency.
For customers, this enables flexible usage-based contracts backed by accurate usage attribution. For engineers, it provides deeper visibility into platform behavior, helping us identify inefficiencies, improve reliability, and accelerate future development.
Perhaps the most valuable lesson from this project is that observability can be a product in its own right. While billing was the initial use case, the operational insights unlocked by these metrics continue to create value across the platform. As the LiveRamp Clean Room evolves, that visibility will help us build more efficient systems, deliver better customer experiences, and scale with confidence.
For more technical reviews and implementation guides, check out LiveRamp’s engineering blogs or reach out to ops@liveramp.com.