Key takeaways
- LiveRamp replaced a fragmented monitoring setup with a unified Grafana Cloud stack powered by Alloy and Fleet Management.
- The migration eliminated multiple tools by centralizing metrics, logs, and alerts across all Kubernetes clusters.
- Terraform automation now handles Grafana provisioning and updates, ensuring consistency and faster deployments.
- Log and metrics pipelines were optimized to lower resource consumption, improve performance, and enable cost visibility through OpenCost.
Visibility in clean rooms can get complicated fast. Engineers often rely on multiple tools across clusters – Robusta, Datadog, Grafana, and Fluent Bit, to name a few – each serving a different purpose.
In the control plane, Robusta and kube-prometheus-stack handle baseline Kubernetes monitoring and send Slack alerts. Datadog collects logs from core services, while Fluent Bit ships Spark driver logs to GCS/S3 for later access via Airflow. Prometheus Operator configurations like ServiceMonitor and custom ScrapeConfigs feed metrics into Grafana dashboards.
The data plane is lighter – mainly Robusta and Fluent Bit – since it spans multiple cloud providers. We maintain separate Helm charts (monitoring-gke, monitoring-aks, monitoring-eks).
This fragmented setup created deployment and maintenance overhead, making it hard for engineers to see unified metrics and logs in one place.
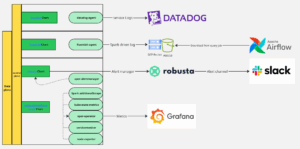
Figure 1: The LiveRamp Clean Room monitoring architecture, FY26Q1
Evolving to a unified observability stack
To simplify and standardize observability, LiveRamp adopted Grafana’s monitoring stack to align with company-wide standards. Since Grafana Agent reaches end of life in November 2025, we migrated to Grafana Alloy – a future-proof collector that’s easier to manage and deeply integrated with Grafana Cloud’s built-in dashboards for a smoother user experience.
We also automated Grafana service provisioning with Terraform, ensuring consistency through infrastructure-as-code. Robusta continues to provide enriched alerts and Slack notifications.
Lastly, we consolidated our setup into a single Helm chart (monitoring-k8s) that works across all Kubernetes platforms, with platform-specific differences handled via values overrides.
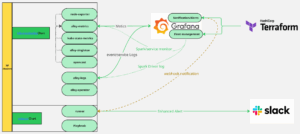
Figure 2: Clean room monitoring architecture, FY26Q2
Most observability functions have now migrated to Grafana Cloud, provisioned and managed through Terraform, while retaining Robusta as an optional add-on.
Migration summary: Comparing old vs. new architectures
The table below outlines the core components of the LiveRamp Clean Room observability stack and compares the previous implementation with the new Grafana-based architecture. Each change highlights how we improved monitoring efficiency, standardization, and scalability.
| Component | Old Implementation | New Implementation | Improvement |
| Spark driver logs | Fluent Bit agent | Grafana Cloud → Fleet Management → Remote Configuration → Custom pipeline |
Logs move from offline to real-time. Managed via Terraform. Centralized configuration control.
|
| Datadog logs | Datadog agent | Grafana Cloud → Fleet Management |
Managed through Terraform. Centralized configuration control.
|
| Spark / custom metrics | Helm overrides with additional ScrapeConfigs and ServiceMonitors | Grafana Cloud metrics pipeline |
Unified metrics collection with simpler configuration.
|
| Robusta alerts | Cluster-local Prometheus alerts | Grafana Cloud → Built-in alerts → Notifications |
Alerts consolidated in Grafana Cloud with unified routing.
|
| Robusta-enriched alert messages | Robusta built-in playbook + Slack sink | Robusta built-in playbooks + Slack sink (optional) |
Made optional for flexibility. Teams can enable as needed.
|
| OpenCost integration | n/a | Default enabled in Grafana Agent / Alloy |
Provides cluster cost metrics out of the box.
|
Installation and configuration overview
You can find step-by-step installation instructions in Grafana → Home → Observability → Kubernetes → Configuration, using either the Helm chart or Terraform code to deploy Grafana Alloy to your cluster.
In our internal setup, we created a monitoring-k8s Helm chart for clean rooms, bundling Robusta as an optional subchart.
After installation, Grafana provides a rich set of built-in dashboards under Home → Observability → Kubernetes → Clusters, where you can monitor cluster health, namespaces, workloads, nodes, and even cost metrics.
Figure 3: Grafana built-in Kubernetes dashboards
Fleet Management at scale
Grafana Fleet Management gives us centralized control over Grafana Agents (and now Alloy collectors) across all Kubernetes clusters. It lets us deploy, monitor, and update configurations at scale – without manually connecting to each cluster.
Fleet Management automatically matches collectors with the correct remote configurations using attributes, ensuring real-time consistency without redeploys or restarts.

Figure 4: Grafana Fleet Management inventory and remote configuration
We built a dedicated Terraform module (fleet_management_pipeline) to dynamically create and manage Fleet Management pipelines, delivering standardized monitoring configurations across all environments.
Below: LiveRamp Clean Room’s Fleet Management Terraform module architecture.

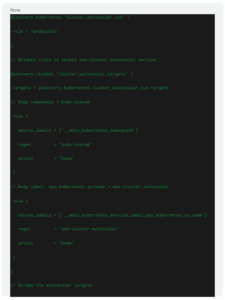
Example: Fleet Management remote configuration
As part of our Fleet Management setup, we created remote configurations that automatically scrape metrics from AWS Cluster Autoscaler endpoints. This allows engineers to monitor scaling events and resource usage across clusters directly within Grafana dashboards – without manually updating scrape configs in each environment.

Robusta-enriched alerts (optional add-on)
Robusta is an open-source Kubernetes observability and automation platform. In our earlier setup, Robusta worked alongside kube-prometheus-stack, but Prometheus consumed significant resources and frequently suffered from OOMKills.
Old vs. new alerting workflows
Old workflow:
Prometheus stacks → Prometheus Alertmanager → Runner in cluster → Slack
Robusta was one of the core monitoring components. In our new architecture, Robusta plays a lighter, optional role. Its Helm chart is bundled within the unified monitoring-k8s chart, allowing teams to enable or disable it as needed.
New workflow:
Grafana alert → Grafana Cloud notification → Robusta Cloud → Runner in cluster → Slack
Why we kept Robusta:
- Lightweight installation: Only the runner and forwarder are installed, reducing cluster load.
- Flexible integration: Optional deployment means it doesn’t interfere with other monitoring or alerting pipelines.
- Free to use: Core features are open source – no premium tiers required.
- Enriched alerts: Robusta can enhance alert messages before forwarding to Slack, improving context for on-call engineers.

Figure 5: An example of a Robusta-enriched alert message
Finding and fixing bottlenecks
During the migration, we identified several Grafana Cloud resource thresholds that required expansion.
Collector number limit
2,000 → 10,000
Each Grafana Cloud stack limits the number of active collectors to protect infrastructure stability. If this limit is exceeded, such as when many nodes each start a new Alloy collector, new collectors fail to register, returning a resource_exhausted error.
When nodes (and their collectors) are deleted, those collectors become inactive. They no longer count toward the limit and are automatically removed after 30 days.
Remote configuration pipeline limit
200 → 1,000
We’re well below this threshold, but it’s worth noting for large-scale environments.
Loki Active streams limit
5,000 → 20,000
Each account can maintain a maximum number of active log streams. We also refined matchers – up to 25 attributes can be used to assign pipelines to collectors.
After rolling out Spark logs, some Alloy-log agents hit the maximum active stream limit exceeded error. Even though we increased the quota, it was quickly exhausted.
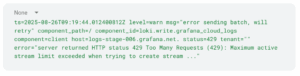
Root cause: Logs contained excessive labels (instance, pod, collector_id, node), most dynamically generated by Spark’s autoscaling and offering little diagnostic value.
Total streams during analysis:
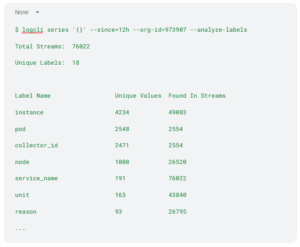
Fix: We filtered non-essential labels from event logs, journal logs, and self-logging streams to reduce load and improve efficiency.
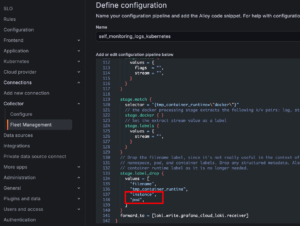
Figure 6: Drop instance pod labels from self-monitoring logs
Results and impact
Migrating our monitoring stack to Grafana Cloud – powered by Alloy and Fleet Management – has streamlined LiveRamp Clean Room operations. Engineers now get a unified, real-time view across clusters with automated provisioning, consistent observability, and reduced overhead.
With Terraform ensuring repeatable deployments and add-ons like Grafana dashboards, OpenCost, and Robusta alerts, LiveRamp’s Clean Room engineering teams have a scalable, cloud-native foundation for next-generation data collaboration.